Web 2.0 digital tools selection: online presentation tools.
by William Guth
In Part 1 of this series, Web 2.0 Digital Tools Selection Criteria , I shared a method for evaluating digital learning tools that may find their way into our online courses. In this continuation entry, I will demonstrate the method in action by discussing tools which I evaluated as part of my course work for Introduction to Online Presentation Tools .
If you missed the last entry and want a quick catch up, the premise of the Web 2.0 Digital Tools Selection Criteria is to quickly evaluate proposed learning tools by measuring their user-friendliness against a thorough checklist which tests for: Accessibility, Usability, Privacy & Intellectual Property protection, Workload & Time Management, and Fun Factor.
Course Objective
The main objective of the course was to explore and evaluate promising alternatives to PowerPoint for presenting information online. In order to familiarize ourselves with the selection criteria the course presented us with a variety of popular technologies to test and select for our evaluations. Click to view the full list of tools and have fun exploring.
Each participant was tasked with selecting two to three from the list to evaluate against the selection criteria checklist, explain how they might use it in their own online course, and whether not we would recommend it to others.
At the time of my participation I was developing an asynchronous Integrated Marketing Communications course with a final presentation component, and a need to present large swaths of numerical data visually; so I chose Google Slides, VoiceThread, and Infogr.am.
The course learning objectives these tools to would need to support were:
To effectively communicate financial consequences of businesses in the areas of strategic intent, profitability, capital returns and shareholder value as it evolves in a digital age; meaning, can you prove that your retail business is Amazon proof.
use ratios to analyze and explain a firm’s liquidity and activity,
use ratios to analyze and explain a firm’s profitability and its market value, and
explain the interactions of the financial statements through financial ratios.
Google Slides
At first glance, Google Slides probably seems like low-hanging fruit. It’s basically a stripped down version of Microsoft Power Point available free online and supported by Google). For our working professional students that makes it easy to learn (Usability). University enrolled students have single-sign-on access to Google Apps through @u.northwestern.edu (Access/Privacy). Work can be shared internally among students/faculty for collaboration and review, or embedded in the Canvas (Privacy/Workload & Time Management). And the software can be used to include multimedia (Fun Factor) Google Slides easily ticked all the boxes on the checklist.
VoiceThread
I felt compelled to try VoiceThread in that it had been recommended by many colleagues before as an alternative discussion tool that could infuse greater social interaction. And as I would come to learn it has easy to use features for incorporating media from a variety of sources allowing participants to layer comments and other media. This type presentation and discussion can not only ramp up asynchronous social interaction, but can introduce active learning opportunities to instructional materials and discussion which take on a life of their own. (Fun Factor, Usability). Designed for education, the web based platform platform operates on most browsers and is accommodates the needs of differently-abled learners such as dyslexic or ADHD, hearing impaired and beyond (Access).
Additionally, I felt obligated to test the tool as despite our best efforts many faculty insist on recording voice over PowerPoint. While VoiceThread is not V.O.P.P . you can utilizes many aspects of the V.O.P.P. approach that faculty are familiar with when it comes to teaching them about the platform and its robust features (Usability). Testing the software helped me discover what to listen for in order to confidently recommend it as an alternative when faced with the prospect of V.O.P.P.
My experience with VoiceThread was much like interactive and rich media production of all kinds. Scripting and pre-production proved to be essential tools for success, a basic knowledge of your computer’s recording tools are required, and it can serve as more than an alternative tool for discussions. The tool can be integrated with LMS systems (e.g. Canvas) and set-up for single sign-on much the way we access BlueJeans (Workload & Time Management, Privacy 7 Intellectual Property)
Check out this example that I created.
( Note: The first slide has no interaction, simply click next slide arrow in the lower right to continue.)
I was drawn to Infogr.am as I have always sought easy to use software and platforms for generating info graphics. These are eye catching graphics for statistics and viral messaging that have taken hold in public and social media. And although Infogr.am is was not designed for the social media purpose, it is a web based platform designed to visualize data and present it in an interactive way (Usability/Fun Factor). Several platforms have this as a feature in some form or another and have a built in utility for importing or linking data for your chart, however, Infogr.am is dedicated solely to data representation and interactivity. This is both its strength and its weakness.
If you’re looking to represent your data visually, Infogr.am has templates and themes as far as the eye can see for charts, graphs, maps and infographics (or reports,) and can accept data in several formats including .csv upload, and .json feed, or update dynamically from Google Sheets.
Each type of graphic is interactive in that you can click, toggle, and hover to display different aspects of the data so there is great potential for students to interact with data and learn from these interactions.
Unfortunately, the platform does not play well with LMS systems where content creators have no control over javascript or CSS which limits the app’s responsiveness ability. In Canvas users can embed their work as an iFrame as you would a YouTube video, but viewing the content on anything smaller than a laptop would be difficult. Infogr.am does have access to video tutorials and How-To instructions, but for uninitiated number cruncher the platform is not all that easy to learn without some frustration.
Related Posts
Using Technology To Develop Students’ Critical Thinking Skills
Recording an Interview Over Blue Jeans
Nebula: A Graphic Interface for Discussion Forums
Tech Blog: Field Recording with Lavalier (TRRS) Microphones
One response to “ Web 2.0 Digital Tools Selection: Online Presentation Tools ”
Amazing Post William, Thanks for sharing it with us.
Your current User-Agent string appears to be from an automated process, if this is incorrect, please click this link:
PowerPoint Tips: Web 2.0 reflections in PowerPoint
July 7, 2011
PowerPoint Tips
By Ellen Finkelstein
Maybe Web 2.0 is already an old look, but you still see a lot of it. Of course, Web 2.0 really refers to how a website functions–especially interactivity and sharing.
But, along with Web 2.0 has come a type of design and one of its main hallmarks is a clean, shiny look. Why shiny? I have no idea, but you see a lot of reflections and highlights. For example, look at the Download button on one of my sites, TellnShow.com , and you’ll see a reflection. (This is my “Campaign Against Death by PowerPoint” site.) The reflection indicates a shiny surface, of course.
Other aspects of Web 2.0 design that you see are subtle gradients, rounded corners, and soft shadows. In fact, if you look again at TellnShow.com , you’ll see that the images have soft shadows.
Add reflections
Reflections are easy in PowerPoint 2007 and 2010. Just select an object and click the Format tab. Click Shape Effects> Reflection and choose one of the options. I have a tip, “Create text reflections ,” that you might also find helpful.
Here’s an example of a slide using reflections. In addition, I used the 3D Rotation feature to angle the left and right rectangles.
Here are the steps to create this effect:
1. Go to Home tab> Drawing group and choose the Rounded Rectangle. Place it on the left side of the slide.
2. Press Ctrl + D to duplicate the rectangle and drag it to the right of the first one. Press Ctrl + D again to get a third. Move them until you get the placement that you want.
3. Double-click the first rectangle to display the Format tab. In the Shape Styles group, choose Shape Fill> Picture. In the dialog box that opens, double-click the picture that you want.
4. Select the first rectangle again. On the Drawing Tools Format tab, choose Shape Effects> Reflections and choose one of the options. I chose Full Reflection, Touching. Do the same for the other rectangles. ( Tip: Just select a rectangle and press F4 to repeat the formatting.)
5. To add the 3D angle, select the first (left) rectangle. On the Drawing Tools Format tab, choose Shape Effects> 3D Rotation and choose an option. For the left rectangle, I chose Perspective Heroic Extreme Right (strange name!) in the Perspective section. Try out a few of the options to see which one you like.
6. Repeat with the right rectangle. I chose Perspective Heroic Extreme Left.
Article continued here
This excerpt is shared with permission from ellenfinkelstein.com.
Stop Responding to Threats. Prevent Them.
Want to get monthly tips & tricks.
Subscribe to our newsletter to get cybersecurity tips & tricks and stay up to date with the constantly evolving world of cybersecurity.
Related Articles
How to Apply a PowerPoint Slide Master
Step by step instruction on how to apply a slide master to an existing PowerPoint presentation.
Create Torn Edge Effect in PowerPoint
Learn how to create a ‘torn edge’ effect in a PowerPoint presentation.
How to Apply Slide Master to PowerPoint
Learn how to how to apply a slide master to an existing PowerPoint presentation.
Teaching and Learning Resources
log in help
Pages & Files
to organize & manage your digital files & messages. Very soon, Dokkio will support Outlook as well as One Drive. Check it out today!
last edited by 13 years ago
From Wikipedia...(an infamous example of a Web 2.0 tool)
describes the changing trends in the use of technology and that aim to enhance , secure information sharing, collaboration and functionality of the web. Web 2.0 concepts have led to the development and evolution of web-based communities and , such as , , , , and . The term became notable after the first Web 2.0 conference in 2004. 1] 2] Although the term suggests a new version of the , it does not refer to an update to any technical specifications, but rather to changes in the ways and utilize the Web.
RSS aggregators--Google Reader, Bloglines
Blogging
Microblogging
Wikis
Website Creation
Task/Project Management
Concept Mapping
Social Bookmarking
Audio Editing & Sharing (Podcasts)
Video Editing & Sharing
Photo Editing and Sharing
Chat Tools
Screen Recorders
Charts & Graphs
File Storage and Sharing
Survey & Polling Tools
Notebook & Annotation Tools
Online Whiteboards
Online Presentations
Personal Web Portals
is maintained by a group of curious teachers who explore and brainstorm ways to integrate Web 2.0 technologies into their teaching. They provide resources and SWOT analyses of a plethora of Web 2.0 tools. A great resource!
Be sure to check out Brian Bensinger's: (a 3 part series) for additional examples and a discussion on how to use these tools in the classroom and at home. Part one covers Web 2.0 tools; part two covers web-based office applications; and part three includes case studies of Web2.0 used in classrooms around the world.
The wiki is devoted to building resources for the classroom and professional development use of Web 2.0 and collaborative technologies. Be sure to check out their free Classroom 2.0 Live Shows and Webinars. You can also join the Classroom 2.0 social network.
(2006). Imagine how you could use Web 2.0 tools in your classroom. This PowerPoint presentation contains hyperlinks and suggested uses. A revised version (2009) of this PowerPoint includes Google videos and more of an overview format-- .
: An Internet Hotlist on Web 2.0 created by Sue Summerford (2008)
contains a plethora of resources related to teaching and learning with technology
Purdue University:
presents a fun and informative series on Web 2.0 technologies in plain English. They create a new video about once a month. Below is a short list of what's available.
Click on any of the badges below to be taken to a brief tutorial on that Web 2.0 tool.
Web 2_0 Tools
Insert links to other pages or uploaded files.
Loading...
To turn text into a link, highlight the text, then click on a page or file from the list above.
Comments ( 0 )
You don't have permission to comment on this page.
PBworks / Help Terms of use / Privacy policy / GDPR
About this workspace Contact the owner / RSS feed / This workspace is public
Instructional Design
Course Design
Course Design Guide
Instructional Plan Worksheet
Steps in Designing a Unit Plan
Bloom's Taxonomy and Learning Objectives
Educational Technology Standards (NETS)
Tools and Instructional Strategies
Course Design Resources
Instructional Approaches
Instructional Strategies
Free Course Content Resources
List of Internet Sites for Education
Faculty Development Resources
Teaching and Learning Centers
Tutorials and Presentations
Videos on the Web
Discipline-specific Resources
e-books, Wikibooks
Teaching Tips
Showcase of Innovative Teaching Practices
Online Training Resource s
Getting Results--Faculty Development Modules (Free)
TeachU Webinar Series (Free)
Magna Publications Resources for Higher Education
lynda.com (subscription-based)
Atomic Learning (subscription-based)
National Science Teachers Association Learning Center (free registration)
International Society for Technology in Education (ISTE) Learning Commons
Scholarship of Teaching and Learning
Journals and Organizations
Publications Related to Teaching and Learning
Web 2.0 Tools
Wikis in Education
Blogs in Education
Social Networking
Video Sharing
Presentations
Social Bookmarking
Web-Based Applications
Photo Sharing
Web-Conferencing
Twitter
Online Data Storage
Cloud Computing
Web 2.0 Links
Directory of Learning Tools
Educational Games
Learning Objects, Educational Games, Animations
Tips on Integrating 3D Learning Activities for Teachers
Integrating i3D into Lesson Plans
Learning Theories
Theories and Theorists (web links)
Andragogy--Adult Learning Theory
Behaviorism
Cognitivism
Constructivism
Connectivism
Learning Styles & Multiple Intelligences
Overview & Links to Inventories
Myers-Briggs/Jung
VAK (Visual, Auditory, Kinesthetic)
Multiple Intelligences
VARK (Visual, Aural, Read/Write, Kinesthetic)
Kolb's Learning Styles Model
Generational Learning Styles
Learning and the Brain
Glossary of Terms
Recent Activity
Office is now Microsoft 365
The all-new Microsoft 365 lets you create, share and collaborate all in one place with your favorite apps
For Organizations
For educators, free or premium: microsoft 365 has you covered.
Everyone gets cloud storage and essential Microsoft 365 apps on the web, free of charge
Create something inspiring
Quickly design anything for you and your family—birthday cards, school flyers, budgets, social posts, videos, and more—no graphic design experience needed.
Store with confidence
Your files and memories stay safe and secure in the cloud, with 5 GB for free and 1 TB+ if you go premium
Share with friends...
...even if they don't have Microsoft 365. Seamlessly collaborate and create files with your friends and family
Protect your personal data
Easily add and monitor your family members' information in your dashboard
More apps in fewer places
The new Microsoft 365 brings together your favorite Microsoft apps all in one, intuitive platform
The best tools. Your best team. The world at your fingertips.
Microsoft 365 empowers your employees to do their best work from anywhere in the world, together in one place
Create anywhere, anytime, with any app
Anyone in your organization can quickly create documents, presentations, and worksheets within a single, unified, Microsoft 365 experience
Your content Your Microsoft 365
Microsoft 365 empowers your organization to organize, and safely store files in OneDrive with intuitive and easy organizational tools
Work together, better
Keep your business connected from anywhere with chat and cloud collaboration tools
Pick up where you left off
Microsoft 365 seamlessly tracks updates, task, and comments across all your files so you can pick up right where you left off
Empower your students and teachers to achieve more
Teachers and students get access to the best tools for learning anywhere—in the classroom, remotely or in a blended environment—for free
Spark creativity and collaboration in any learning environment—whether in the classroom, remote, or blended—with intuitive, inclusive design
Empower your educators
Create equitable learning environments that help students develop knowledge and skills essential for both academic and career success
Learning reimagined
Give students the tools to learn and collaborate on projects together and independently, all in one place
Bring your class together
Microsoft 365 helps your students connect and achieve more together, whether in the classroom, at home, or around the globe
Get the free Microsoft 365 mobile app
Follow Microsoft 365
Mar 29, 2019
1.05k likes | 1.85k Views
All of us are smarter than any one of us. Web 2.0. It’s not the technology; It’s the IMPACT.
Share Presentation
technology news
social bookmarking
own web site
Presentation Transcript
All of us are smarter than any one of us. Web 2.0
It’s not the technology;It’s the IMPACT.
Adapt or Die! becomes the mantra of the day for consultants, analysts, and reporters. Their words become the start gun, signaling the time has come for millions of dollars to be spent ripping up legacy systems and replacing them with the next new thing.
Not necessarily in education…
The Internet and Web 2.0 challenge our concepts of how students learn and how we should teach .Web 2.0 technologies are changing media and challenging schools.
Web 2.0 refers to a supposed second generation of Internet based services that emphasize online collaboration and sharing among users.Wisdom of Crowds--what are the most valuable resources
"Web 2.0 is a widely used phrase devoid of meaningful content.”Businesses vs. home and school
The social web is a term that can be used to describe a subset of Web 2.0 technologies that are highly interactive, conversational and participatory.
Features of social web applications Expressing and developing identity (especially for youth). Relationships Trust User-driven and generated sites and content --rather than passive consumers, surfers can become active creators.
Social Media • the democratization of content • shifts from a broadcast mechanism to a many-to-many model • “wisdom of crowds” to connect information in a collaborative manner
Imagine a web site where a teacher, counselor, administrator or student could create his own web site that includes 50 Mb of file storage and sharing space, on-line slide shows, web site bookmarking, blogging, threaded discussions, and real-time polling. Now imagine the same site that is free to use and free of advertising. Lastly, imagine that all is needed to use this site is a computer connected to the Internet.
Real World Learning Objectswww.rwlo.org
A weblog( web log), more commonly known as blog, is a shared online journal of chronological events that are kept in reverse order. A blog is essentially an online journal or diary.(myspace) What are Blogs
Who’s blogging? • October 2006 56 million active blogs • January 2007 63.2 million active blogs • Sept. 2007 106 million active blogs • 175,000 blogs begun daily • 200 million inactive or abandoned blogs
Types of Educational Blogs • Information and Updates • Teacher or student generated to keep readers informed • Collaborative Project Blogs • Multiple classrooms or schools posting to a site or to each other • Written Expression Blogs • Individual or classroom blogs created to post student work
Informational Blogs • Journal of events • Classroom highlights • Remediation or review • Student recognition • Homework or external assignments
Blogger—a free site that produces: http://cognobics.blogspot.com
“106 million blogs--some of them have to be good”
Neat applications that encourage personal exploration or creative response How about me?
iShowU • Screen capture application • Useful to save streaming video http://www.shinywhitebox.com/home/home.html
Furl • Web page saving tool
TV capture • eyeTV • WinTV • Coupled with TitanTV
P2P sharing If you want it, it’s available. Kazaa, Morpheus, Limewire
Peer-to-Peer Network
A peer-to-peer ("P2P") computer network exploits diverse connectivity between participants in a network and the cumulative bandwidth of network rather than the typical centralized resources where a relatively low number of servers provide the core service or application.Wikipedia
“Digg is democratizing digital media.” Digg is a technology news website that combines social bookmarking, blogging, RSS, and non-hierarchical editorial control. With digg, users submit stories for review, but rather than allow an editor to decide which stories go on the homepage, the users do. Digghttp://www.digg.com
del.icio.ushttp://www.del.icio.us del.icio.us is a collection of favorites - yours and everyone else's. Use del.icio.us to keep links, share favorites with friends, family, and colleagues, discover new things.
Flickrhttp://www.flickr.com Flickr - almost certainly the best online photo management and sharing application in the world - has two main goals: • We want to help people make their photos available to the people who matter to them. • We want to enable new ways of organizing photos.
Picture sharing and editing Picnik
Flock Flock is an amazing new web browser that makes it easier to share media and connect to other people online. Share photos, automatically stay up-to-date with new content from your favorite sites, and search the Web with the most advanced Search Toolbar available today.
More by User
WEB 2.0. Why is it important?. What is a web 2.0?. How can it work for teachers, librarians and information professionals?. What is Web 2.0?. The participatory web The amateurization of the web The social web The user-focused web. What is Web 2.0?. The participatory web
635 views • 24 slides
Web 2.0. Sandra Hines & Kim Estes Burleson ISD Instructional Technology. TCEA 2008 – Feb. 6, 2008 Web-20-tools.ppt. Web 2.0. Used under the Creative Commons License Adapted from presentation created by Joel Adkins http://www.slideshare.net/mrjadkins. Presenter: Joel Adkins
808 views • 45 slides
Web 2.0. By Martin King. Features of Web 2.0. Information Search: Search engine helps in finding relevant information for the keywords entered. It includes website designing, website ranking in search engine, keyword research, etc.
273 views • 9 slides
Web 2.0?. Web 1.0 Web 2.0 DoubleClick --> Google AdSense Ofoto --> Flickr Akamai --> BitTorrent mp3.com --> Napster Britannica Online --> Wikipedia personal websites --> blogging evite --> upcoming.org and EVDB domain name speculation --> search engine optimization
272 views • 13 slides
Web 2.0. Do you Web 2.0?. The following slides will show you different Web 2.0 websites and tools. To check out the websites, you can either click on the link at the bottom of the slide or click on the icon in the title. A is for. http://animoto.com/. B is for. http://blabberize.com/.
451 views • 30 slides
Web 2.0. NMTIE Dr. Linda K. Thompson Ann M. Lumm. Welcome and Introductions. Overview of Web 2.0 Tools. What is Web 2.0? go2web20 is a collection of Web 2.0 resources Video Why should educators use Web 2.0 Tools?. Collaboration and Communication Tools.
280 views • 11 slides
Web 2.0. WHAT IS WEB 2.0? How does it differ from Web 1.0?. Web 2.0 allows users to interact, share information, collaborate, and create their own contents. Web 1.0 only let users receive information but Web 2.0 allows users to comments and edit information.
205 views • 6 slides
Web 2.0. Having close relationships are critical. They can help you make decisions and be there to help you in many different ways. In order to keep valuable customers, you need to build relationships with them.
184 views • 1 slides
Web 2.0. Debi McGuire. What is Web 2.0?. What is Web 2.0?. Huge paradigm shift in the Internet Social implications that impact education Tools are powerful, useful, and collaborative Students already using them anyway. Web as a Platform.
262 views • 16 slides
Web 2.0. 7-10 (12:30-3:30) 8-7 (8:30-11:30). What is Web 2.0? It is just the term for web-based applications and programs that focus on information sharing and user created content and collaboration, such as youtube, Facebook etc.
175 views • 5 slides
Web 2.0. The Read/Write Web. History. Tim Berners-Lee: World Wide Web 1989 Dream of sharing information back and forth Mosaic Web browser in 1993 Writing to the web required knowledge of HTML codes and more. The New World Wide Web. New way software developers and users utilize the web.
282 views • 16 slides
Presentation Collections
Explore 10+ Free PowerPoint Templates and Presentation Sites
It is no news that for anyone who has the need for using PowerPoint on a frequent basis, creating a presentation is rather a task. But it’s not just about what they write it is important that what they write is stylish and well presented on a computer screen.
Since more than thirty million presentations are created daily in PP, it is challenging to find a template suitable for the project.
However one should not let this deter him/her from preparing a well-orchestrated power point. To assist everyone who might be in a hurry to create an uncluttered and attractive presentation, below are more than 10 free PowerPoint templates.
3 Tips for Choosing the Best Free Presentation Template
With all these free PowerPoint presentation templates out there, looking for the correct one can be intriguing and a little bit challenging. Here are three tips that will help you in finding the perfect match:
1. Need-based: Versatility and Customizability
While choosing a new PowerPoint template, one has to take into consideration the features of its customization. With this regard, according to some recent presentation stats, 47% of the presentation designers claimed that making a PowerPoint presentation on their own requires more than 8 hours, while 29.4% needed the help of other designers or professionals. Thus, the availability of customizable PowerPoint templates is crucial for saving lots of precious time in the design process.
2. Neat Appearance: Uniformity and Professionalism
The art of selecting free PPT templates is to make the content appealing and professional in structure. The tricky part of this leads many to delegate PowerPoint presentation design in order to be able to provide their target audience with content in a format that suits their needs and taste.
3. Capture Attention Effectively: Visually Pleasing and Aesthetic Feel
Enticing presentations are key to delivering your message across. With the 10-minute rule for presentations, a diatribe of attention just occurs after 9 minutes and 59 seconds. That’s why choosing a free template should be done with much meticulousness to ensure that it contains visually consistent, yet really simple elements, illustrations, and infographics to guarantee your presentation a success.
Top 3 Best Free PowerPoint Templates
It is always good to have more than 10 free PowerPoint templates, as available, but to get the right one may sometimes be a little tasking. To assist with this the top three recommendations have been made based on their ability to design PowerPoint presentations for professional use in a variety of sectors.
1. Microsoft
Who else to find free PPT templates from than those creating all the fuss, Microsoft? Knowing something or two about designing a good PowerPoint presentation, the official Microsoft website brings an incredibly broad and various selection of templates – all the way from lively, bright, and colored to severe, formal, and educational.
Why: It offers a great variety, well-designed, diverse PowerPoint templates for free download
Pros: Official site of PowerPoint with different template types, all of which are easy to download and use.
Best for: Professional, fun, aesthetic, artsy, business, and all other forms of PowerPoint templates.
2. SlideEgg
SlideEgg is an online resource offering ready-made presentation designs that one can use as a basis for presentations. They specialize in PowerPoint and Google Slides template and have recently incorporated Canva as an editing option.
Why: Covers all categories of customizable, nice-looking, and theme-based PowerPoint templates.
Strengths: The website is easy to move around and find the correct PowerPoint templates for free download
Ideal for: Business, Education, and professional PowerPoint templates.
3. The Power of PowerPoint (POPP)
Power of PowerPoint hosts the largest free library of PowerPoint templates for all kinds of presentations one might want to do, together with a very professional and slick look.
Why: Great resource for those who like to customize the template for their needs.
Strengths: Offers an extensive collection of free and customizable PowerPoint templates.
Top 10 Website Sources of Best PPT templates for free download
The answer to a common question—where can the best PowerPoint templates be downloaded for free online? Below are the top 10 websites offering free PowerPoint templates.
PresentationGO: PresentationGO is indeed a robust library for PowerPoint templates, with over 30 pages of new, purpose-serving unique templates.
Behance: The best of the best design talents are represented on Behance, which you will be able to see in their free slides templates. Templates such as this startup pitch deck help tell a story with visuals really coming alive to tell the story.
FPPT: It offers some of the best templates for presentations, like the Molecule template, which can be used in a business or even medical application. These highly designed templates provided by FPPT help in capturing the interest of your audience while delivering the message in front of them.
AllPPT: In search of a slide deck specifically real estate, then ALLPPT is your go-to destination for real estate PowerPoint templates. ALLPPT slide layouts feature more than numerous categories, which range from finance and business to recreation, sports, military, etc.
Graphic Panda: Graphic Panda brings together a host of very iconic PowerPoint templates to get your presentation needs done. These include the Company Profile template among others on business and startups.
Kingsoft: Kingsoft does brilliant work with its free PPT templates for business individuals. You can use the slide decks for everything from pitches to corporate meetings.
Free PPT Backgrounds: Free PPT Backgrounds is great for when you need an ultra-simple, minimal template that’s super easy to customize. These templates make it so easy to get up and running.
Leawo: It is full of creativity, variety, and will help you make outstanding slide decks. The wide collection of free PPT templates covers everything, from NBA themes to Disney and finance.
E-learning Heroes: If you want to liven up your presentations, grab a free template with slick design from E-Learning Heroes. Having these in hand, your presentations are going to be that much more persuasive and convincing.
Indezine: This is a site that enables you to name a fair price of your own to download some great looking PowerPoint templates and designs. You can very well opt to pay zero; however, you will surely realize that these templates are worth much more.
Designing a stunning and effective PowerPoint presentation doesn’t need to be such a chore. From these finest free templates to the tips provided, you can come up with presentations that look professional and above all, engage your audience. The right template will really make a big difference in how your message is perceived by your audience. So, surf through these resources; find one that really fits your needs, and then go ahead to create those presentations that will really stand out—Happy Presentation!
Spread Love
Related blogs.
Pramod Malnatchi
Pramod Malnatchi is an experienced content strategist with over 3 years of active practice. He excels at using his broad experience to provide clear, concise, and interesting data-driven content in different niches. With his skills in PowerPoint presentations and Google Slides, Pramod is capable of making an idea visually interesting in terms of presentation. He ensures the quality and accuracy of information in every project by doing thorough research and consulting with experts in the field.
Recent Blogs
How to use Google Slides offline and Work Anywhere?
Google Slides is equally a perfect tool that can be used in the creation and sharing of presentations. Use is...
How To Make A Graph In Google Slides
Google Slides is a powerful tool for creating presentations, but it also offers a variety of features for visualizing data....
How to Create Simple Flowchart Presentation for Recruiters
Simplify your recruitment process and attract your audience with engaging flowchart presentations that make an impact. In today’s job market,...
SIGNUP FOR NEWSLETTER
Academia.edu no longer supports Internet Explorer.
To browse Academia.edu and the wider internet faster and more securely, please take a few seconds to upgrade your browser .
Enter the email address you signed up with and we'll email you a reset link.
We're Hiring!
Help Center
Selecting a Web 2.0 Presentation Tool
Related Papers
Meinald T Thielsch
Language and Literacy
Kent Manning
Asri S Fatimah
This study aims at analyzing reflection of the use of prezi as instructional media for teaching English in Indonesian context. Prezi is presentation software which is not commonly used in Indonesia producing a cloud-based presentation and storytelling tool for presenting ideas on a virtual canvas. This study is conducted based on the previous survey study done by Fox et.al (2016) finding that all of the students in their study preferred prezi rather than power point as a presentation tool in the areas of ease of use, fun to use, text, graphics, and usage in future presentations. However, this study has a purpose to reflect the student-teacher’s experience when using prezi in teaching English. To obtain the data, journal writing and self-observation by using video recording are used. It deeply investigates: 1) how he creates prezi for teaching English and 2) challenges and benefits of using it for teaching. The finding revealed that prezi is a powerful tool attracting the students’ a...
David Harris
In this paper, critical discussions of electronic presentation software, initially focused on PowerPoint, are reviewed. The potentials and pedagogic implications of newer forms, such as Microsoft Producer, Prezi and Xerte, are then considered. Discussion turns to whether teaching technologies, including face to face formats, constrain or prompt pedagogic innovation. An argument is developed about using presentation software in a different context to construct learning objects (stand-alone online resources), to isolate the effects of the presentation software itself. Finally, non-technological issues which also affect actual use are considered, especially in teaching subject specialisms like leisure studies.
MATEC Web of Conferences
Maria Magdalena Widiantari
IJ Publication
Online presentation in a virtual class has two critical needs: the presenter should be able to make changes in the presentation dynamically and the participants should be able to interact with the presentation. Without the interaction of the participants, the presenter has no feedback cues to alter her presentation dynamically to suit the condition of the participants. Existing online presentation tools only allow sharing screen, streaming video, and mixing quizzes. There is still a need for a coherent web-based medium to build dynamic and interactive presentations. Runestone is an ecosystem for interactive textbooks. With interactive books, readers can interact with them. This involves bringing in a HTML5 based presentation system such as reveal.js features into runestone. First, the stylesheets need to be designed for presentation. The stylesheet will have to be designed to make the webpages as a presentation made of a sequence of slides instead of continuous pages. Secondly, the webpages will have to be synchronized such that the presenter will be able synchronize the viewing for all the participants. To mitigate the tedious HTML code of the presentation, the presentation will be prepared in a lighter markup language such as Restructured text (rst) and then, using Python scripts, the rst file will be converted to html file. There will be two modes namely user control mode and presenter control mode. In presenter control mode, the presenter will control the navigation of the slides for all the users. In user control mode, the user is free to navigate to any page of the presentation and interact with it. This project develops a web-based tool with these features: a presentation is a sequence of web pages; the presentation can be prepared using an extensible markdown language; the presenter can synchronize the viewing of the pages or, as the need arises, let the users navigate the pages freely; the presenter can make changes and execute programs in the page, which will be executed in a server; participants can make changes and execute programs in the pages, which will be executed in the browser itself; presentation can have a variety of questions (MCQ, short answer, program snippets) and participants can answer these questions with immediate helpful feedback; the responses of the participants to the questions will give feedback to the presenter as to the effectiveness of the presentation.
Anna Szafrańska (Szafrańska-Gajdzica; Gajdzica)
The article describes the preliminary results of the implementation of WorkPackage 4 (WP4) “Selection and testing new ICT tools” in the framework of the international research network IRNe, represented by researchers from partner institutions in Poland, Slovakia, Ukraine, Australia. These results concern the analysis and study of some categories of ICT-tools for making multimedia presentations and didactic videos. All the package period has been divided into 5 main stages. Authors presented a ranking list based on quality and quantity assessment of chosen ICT-tools and proposed some recommendations of features for good presentation and didactic video as well as specified typical mistakes of designers and users.
2013 International Conference on Informatics and Creative Multimedia
Kazunori Sugiura
Journal of Education and Learning (EduLearn)
The teaching and learning styles that teachers and students apply in their teaching and learning have dramatically changed due to technological advances particularly in computer. Technological advancements are affecting the way we teach and learn. Technology has found a profound home in the world of teaching and learning. Teaching/learning technologies (TLT) have received considerable attention of many including academicians in recent years. The promises of TLT vary for the respective publics. Many insist that students today do not learn well with traditional teaching and learning methods. They argue that students require presentations that are visual and stimulating. Classroom teachers hold the key to the effective use of technology to improve learning. Whatever the varying perceptions of the promises of teaching, leaning, technology, presentation instruction in the classroom, using the Web for teaching the bulk of their course, and many other faculty are considering adopting such technologies. This paper will examine some of the advantages and disadvantages of only one type of TLT, presentational technology in the classroom, and some of the issues for faculty to consider before adopting it.
Academic Radiology
Lynn Broderick
Loading Preview
Sorry, preview is currently unavailable. You can download the paper by clicking the button above.
RELATED PAPERS
Beat Signer
INTED2019 Proceedings
Raquel Sanchis
Reinout Roels , Beat Signer
Swapna Kumar
Christopher Sessums
2009 IEEE International Professional Communication Conference
Terrance Goan
International Journal of Knowledge Society Research
Maira Kotsovoulou
Innovative Higher Education
Russell Craig
Hue University Journal of Science: Social Sciences and Humanities
Kenneth E Colwell
Proceeding of the twenty-sixth annual CHI conference on Human factors in computing systems - CHI '08
The CU Online Handbook
Patrick Lowenthal
Issues and Challenges
Pavel Samsonov
Bernardo Gaspar
Abuobieda Abusharib , moawia A alshiek
iliasu ibrahim
International Journal of e-Education, e-Business, e-Management and e-Learning
To move to the previous or next slide, select Previous or Next .
To view all the slides in your presentation, select See all slides .
You can choose which language the caption/subtitle text should be shown to your audience. This feature is compatible with the following web browsers: Microsoft Edge, Google Chrome 34+, Mozilla Firefox 25+.
Select View > Always Use Subtitles .
Set your Spoken Language .
Select Subtitle Language to see which languages PowerPoint can display on-screen as captions or subtitles, and select the one you want.
In the Subtitle Settings menu, set the desired position of the captions or subtitles.
Need more help?
Want more options.
Explore subscription benefits, browse training courses, learn how to secure your device, and more.
Microsoft 365 subscription benefits
Microsoft 365 training
Microsoft security
Accessibility center
Communities help you ask and answer questions, give feedback, and hear from experts with rich knowledge.
Ask the Microsoft Community
Microsoft Tech Community
Windows Insiders
Microsoft 365 Insiders
Was this information helpful?
Thank you for your feedback.
Services & Software
SlideAware makes PowerPoint a Web 2.0 app
SlideAware works with PowerPoint to put your presentations on the Web.
We're big fans of Web-based productivity apps here at Webware, but we also like tools that bring Web 2.0 features, such as easy collaboration and access from anywhere, to the apps we know and use already. Xcellery ( see Xcellery review ) does that for Excel, and a new app, SlideAware , does a similar thing for PowerPoint.
SlideAware has two components. First, there's a plug-in you add to your PowerPoint toolbar (it doesn't work for Office 2007 yet, so I couldn't test this component). The plug-in lets you zap your PowerPoint presentations directly to the SlideAware service.
From the SlideAware Web site, you can create simple URLs for each of your presentations. When somebody wants to watch or join a presentation, all they have to do is go to the URL. Either you (the presenter) can have control over which slide is presented onscreen, or the user can walk through the presentation. It's not immediately obvious how to select the control mode, though, and you can't change control during a presentation. In other words, if you're leading a presentation, you can't hand the steering wheel to the viewer midstream.
I like the protection and stats that SlideAware provides. You can protect presentations with passwords, put expiration dates on them, or limit the number of views before a slide show becomes inaccessible. You also get a nice stats viewer that shows you how long your viewers are spending on each slide (for the viewer-led shows only). Mostly, I like that it's easy: from within PowerPoint, you can kick off the process to make a presentation Web-accessible. However, you can only upload a slide show to the service from the plug-in. There's no upload feature on the site itself. That's an annoying omission.
The service is still young and there are important features that have yet to be added. The SlideAware team plans to add annotation features, for example. Also in the works, a work-group library feature that will provide teams with a better way to manage PowerPoint libraries and boilerplate presentation templates.
Despites its light feature set, PowerPoint users may find SlideAware extremely useful. It essentially Web 2.0-enables Microsoft's product. Until Microsoft provides that feature itself (which it may well do), it's a very good option.
The services is free at sign up. Paid subscriptions will allow corporate branding on the presentation viewer, access to the statistics feature, and unlimited presentation storage.
SlideAware was demonstrated to the audience at the Under the Radar conference. The audience also was exposed to a competing vision, best represented by another product, Spresent . The product (see previous Spresent review ) is a very good online presentation tool, but instead of taking your library of PowerPoint presentations and making it ready for the Web, Spresent offers a more cohesive online experience since it was designed from scratch for the online platform. For best results, users need to create their presentations on the Spresent site. You'll get neater slide shows than what SlideAware can display, but it means learning a new presentation tool. Founder Alexander Kouznetsou and I had a loud discussion about the benefits (which he was pitching) and pitfalls (me--or the sake of argument) of asking presenters to start over with a new tool. We both felt we won. In other words, we couldn't agree. What's your take?
Services and Software Guides
Best iPhone VPN
Best Free VPN
Best Android VPN
Best Mac VPN
Best Mobile VPN
Best VPN for Firestick
Best VPN for Windows
Fastest VPN
Best Cheap VPN
Best Password Manager
Best Antivirus
Best Identity Theft Protection
Best LastPass Alternative
Best Live TV Streaming Service
Best Streaming Service
Best Free TV Streaming Service
Best Music Streaming Services
Best Web Hosting
Best Minecraft Server Hosting
Best Website Builder
Best Dating Sites
Best Language Learning Apps
Best Weather App
Best Stargazing Apps
Best Cloud Storage
Best Resume Writing Services
New Coverage on Operating Systems
Content collaboration
Getty Images/iStockphoto
How to take advantage of Copilot for SharePoint
Copilot -- microsoft's ai chatbot tool -- works in several other apps, including sharepoint. together, copilot and sharepoint can simplify site and content creation..
Reda Chouffani, Biz Technology Solutions
Over the years, Microsoft has continued to refine SharePoint's capabilities and functionality. When combined with AI, the wealth of data stored in the platform offers new opportunities for businesses.
With the introduction of Microsoft's AI engine and its new service -- Copilot -- organizations can find more ways to interact with and analyze their content and data. Copilot in SharePoint enables users to perform tasks in new ways to increase employee efficiency and gain new insights from the data stored in SharePoint.
Prerequisites for using Copilot for SharePoint
Businesses have several prerequisites to meet before they can use Copilot with SharePoint -- primarily licenses and security access.
For licensed access, organizations need both SharePoint Online and Microsoft Copilot licenses . Once these are available to users, they can access Copilot. For SharePoint specifically, businesses can use the bundled license that comes with several existing Microsoft 365 plans. Then, organizations have the option to choose Copilot for Microsoft 365, which costs $30 per user monthly, or Copilot Pro, which is $20 per user monthly.
Businesses also require proper security and access to the SharePoint portal that hosts the data or site the user needs to access. This is based more on the organization's existing security permissions with SharePoint rather than something new to adopt with Copilot, but it's worth revisiting to ensure users have proper access to certain data and Copilot can access all relevant content.
How to use Copilot in SharePoint
Copilot is not limited to a single Microsoft tool, like Teams or Word. With its availability in SharePoint, users can instruct it to perform tasks related to SharePoint pages. For example, a user could ask Copilot to write a summary of an article or provide ideas.
Businesses can also use Copilot from other areas besides SharePoint that can still access its content, including through a dedicated chatbot that users can design and deploy with Copilot Studio.
Overall, Copilot can help users generate and manage SharePoint sites more efficiently and interact with stored data. The tool helps users maintain consistent branding and customize site formatting , as it can learn the brand's style over time and adapt to it when creating new content or suggesting new site styles to enhance UX.
SharePoint Premium users can take advantage of more advanced Copilot features, like content translation, video analysis and document intelligence -- which analyzes documents and can extract text or data.
Benefits of using Copilot in SharePoint
Copilot brings several new capabilities to SharePoint, including the following:
1. Site administration and authoring
SharePoint users can generate new sites quickly with Copilot's chat feature . This can save time during site creation, including its content and formatting, and it eliminates the need for users to learn how to create sites. Copilot also lets users upload documents to the chatbot and have their content used for the site pages, as well.
2. Interact with data stored in SharePoint
Employees can also use Copilot to locate content easily. With Microsoft Copilot Studio -- which lets users create automations and bots -- or standard Copilot, users can ask the tool for any information accessible to them and stored in SharePoint without having to search for or locate it themselves. This feature lets Copilot mine SharePoint's content and lets users easily access it through the chat.
3. Create apps with Power Apps
Microsoft moved away from InfoPath and introduced Power Apps to generate apps that collect data stored in SharePoint. Users can wield Copilot and Power Apps together to generate these apps. If a user instructs Copilot to make an app, it can generate one that stores its data in SharePoint.
4. Enhanced brand management
Copilot can ensure all sites generated through AI have a consistent look and feel. It can also enable users to further customize their sites and improve formatting without any prior training.
5. Enable more automation
In addition to Copilot's standard capabilities for SharePoint -- content creation, site creation and search capabilities -- SharePoint Premium includes content translation, video analysis, document intelligence and content extraction from documents stored in libraries. Copilot could further enhance the experience for users looking to classify content and apply more automation with SharePoint Premium.
Key takeaways
Microsoft Copilot uses generative AI and large language models, so its integration with SharePoint can create more efficient workflows and deeper insights into data. With Copilot, SharePoint users can change their approach to site administration, content management and data interaction. This integration simplifies complex tasks through chat interfaces and makes information more accessible and actionable.
Organizations must have the appropriate licenses and proper security measures for a successful implementation. And with options such as Copilot for Microsoft 365 and Copilot Pro , organizations can choose the best plan to suit their needs.
In essence, Copilot for SharePoint can help organizations improve how they use their digital assets, drive innovation and improve operational efficiency.
Reda Chouffani runs the consulting practice he co-founded, Biz Technology Solutions, Inc. He is a healthcare informatics consultant, cloud expert and business intelligence architect who helps enterprise clients make the best use of technology to streamline operations and improve productivity.
Related Resources
10 Content Collaboration Platforms for Enterprises in 2024 –TechTarget
A Computer Weekly buyer's guide to the future of collaboration –TechTarget ComputerWeekly.com
Computer Weekly – 9 October 2018: NHS app marks a new era for UK health service –TechTarget ComputerWeekly.com
Dig Deeper on Content collaboration
Compare SharePoint 2019 vs. SharePoint Online
Microsoft 365 Copilot features and architecture explained
Understanding the use cases of Copilot for Microsoft 365
5 SharePoint migration tools to consider
A data-driven decision-making framework provides guidelines that any organization or individual can use. Improve decision-making ...
As enterprise use of generative AI evolves from theory to practice, it remains the dominant development focus, with governance ...
Selecting the right embedded analytics tool for your organization can be difficult. Use general criteria to evaluate eight of the...
The observability specialist's latest financing, along with strong recurring revenue and customer growth, helps set the vendor up...
Serverless, first launched on AWS, is now available on all three major public clouds in a move aimed at enabling customers to ...
Implementing a data governance strategy requires a roadmap to keep everyone on track and overcome challenges. Follow eight key ...
ERP implementations are complicated processes that can easily go awry. Learn about some of the most common issues and ways to ...
Salesforce and Workday are partnering on integrating AI data. However, the combined forces of the enterprise application giants ...
Data analytics can help manufacturing leaders make more informed decisions when planning for the industry's future. Learn about ...
With its Cerner acquisition, Oracle sets its sights on creating a national, anonymized patient database -- a road filled with ...
Oracle plans to acquire Cerner in a deal valued at about $30B. The second-largest EHR vendor in the U.S. could inject new life ...
The Supreme Court ruled 6-2 that Java APIs used in Android phones are not subject to American copyright law, ending a ...
SAP and Collibra expand their partnership, integrating Collibra's data governance tools into SAP Datasphere, bolstering data ...
As SAP pushes its clean core methodology for S/4HANA Cloud environments, the partners who customized legacy SAP systems will need...
Two executive board members will depart SAP in a move that the company says is both to streamline the structure of the board and ...
Web 2.0 PowerPoint Template (PowerPoint PPTX)
This product ( Web 2.0 PowerPoint Template ) is a 8-slide PPT PowerPoint presentation (PPTX), which you can download immediately upon purchase.
"Last Sunday morning, I was diligently working on an important presentation for a client and found myself in need of additional content and suitable templates for various types of graphics. Flevy.com proved to be a treasure trove for both content and design at a reasonable price, considering the time I "
"Flevy is now a part of my business routine. I visit Flevy at least 3 times each month.
Flevy has become my preferred learning source, because what it provides is practical, current, and useful in this era where the business world is being rewritten.
In today's environment where there are so "
"[Flevy] produces some great work that has been/continues to be of immense help not only to myself, but as I seek to provide professional services to my clients, it give me a large "tool box" of resources that are critical to provide them with the quality of service and outcomes they are expecting."
"FlevyPro has been a brilliant resource for me, as an independent growth consultant, to access a vast knowledge bank of presentations to support my work with clients. In terms of RoI, the value I received from the very first presentation I downloaded paid for my subscription many times over! The "
"I have used Flevy services for a number of years and have never, ever been disappointed. As a matter of fact, David and his team continue, time after time, to impress me with their willingness to assist and in the real sense of the word. I have concluded in fact "
"As a consulting firm, we had been creating subject matter training materials for our people and found the excellent materials on Flevy, which saved us 100's of hours of re-creating what already exists on the Flevy materials we purchased."
"As a small business owner, the resource material available from FlevyPro has proven to be invaluable. The ability to search for material on demand based our project events and client requirements was great for me and proved very beneficial to my clients. Importantly, being able to easily edit and tailor "
"As a consultant requiring up to date and professional material that will be of value and use to my clients, I find Flevy a very reliable resource.
The variety and quality of material available through Flevy offers a very useful and commanding source for information. Using Flevy saves me time, enhances my expertise and ends up being a good decision."
Here are a few, select highlights of the many we have for Power BI. You can now ask Copilot questions against your semantic model. Updated Save and Upload to OneDrive Flow in Power BI and Narrative visual with Copilot is available in SaaS embed. There is much more to explore, please continue to read on!
European Fabric Community Conference
Join us at Europe’s first Fabric Community Conference , the ultimate Power BI, Fabric, SQL & AI learning event in Stockholm, Sweden from September 24 -27, 2024 .
With 120 sessions, daily keynotes, 10 pre-conference workshops, an expo hall with community lounge, and “ask the expert” area, the conference offers a rich learning experience you don’t want to miss. This is a unique opportunity to meet the Microsoft teams building these products, customers betting their business on them, and partners at the forefront of deployment and adoption.
Register today using code MSCUST for an exclusive discount!
Fabric Sticker Challenge Winners Announced!
The Fabric Community Sticker Challenge launched August 1-23 and winners are in! All Fabric Community members were invited to create unique stickers showcasing their enthusiasm and creativity under the following categories: Community Enthusiasm, Inspirational, “Inside Joke” for developers and data, and Super Users. To see winning designs, check out our Community News . Thank you all who participated in this challenge; it was great to see so much involvement!
Fabric Influencers Spotlight
Check out our latest initiative, the Fabric Influencers Spotlight . Each month, we’ll be highlighting some of the great blog, videos presentations and other contributions submitted by members of Microsoft MVP & Fabric Super User communities that cover the Fabric Platform, Data Engineering & Data Science in Fabric, Data Warehousing, Power BI, Real-Time Intelligence, Data Integration, Fabric Administration & Governance, Databases and Learning.
Attention Power BI users!
If you are accessing Power BI on a web browser version older than Chrome 94, Edge 94, Safari 16.4, Firefox 93, or equivalent, you need upgrade your web browser to a newer version by August 31, 2024 . Using an outdated browser version after this date, may prevent you from accessing features in Power BI.
Version number: v: 2.132.908.0
Date published: 8/19/24
Ask Copilot questions against your semantic model (preview)
Visual level format strings (preview)
Dynamic per recipient subscriptions (Generally Available)
Deliver subscriptions to OneDrive and SharePoint (Generally Available)
Updated Save and Upload to OneDrive Flow in Power BI
Visuals, shapes and line enhancements
DAX query view in the web
Narrative visual with Copilot available in SaaS embed
Editor’s pick of the quarter
New visuals in appsource, filter by powerviz, pie of pie by jta, drill down pie pro by zoomcharts, hierarchical bar chart, deneb: declarative visualization in power bi.
Paginated Reports: Sharing of reports connecting to Get Data data sources made easy
Copilot and AI
Ask copilot questions against your semantic model (preview).
We are pleased to announce that you can now ask Copilot for data from your entire semantic model in Desktop ! Just tell Copilot what you’re looking for, and Copilot will query your model to answer your question with a visual.
To use this new capability, you need to have the Preview feature for “ Copilot chat pane in report view” turned on. If you already have done this there is nothing else that you to need to utilize this new capability.
To find out more about how this feature works and the types of questions that are supported check out our previous blog post and documentation page .
Visual level format strings are here, providing you with more options to configure formatting. Originally built for visual calculations, the core ability that visual-level format strings provide is the ability to format visual calculations. Since visual calculations are not in the model, you could not format them, unless you were using them in data labels or in specific parts of the new card and new slicer visuals. With visual level format strings, you can!
Visual level format strings, however, are useful even without using visual calculations.
With the introduction of visual-level format strings, Power BI now has three levels for format strings:
Model. You can set a format string for columns and measures in the model. Anywhere you use that column or measure the format string will be applied, unless it’s overridden by a visual or element level format string.
Visual. This is what we’re introducing today. You can set format strings on any column, measure or visual calculation that is on your visual, even if they already had a format string. In that case the model level format string will be overridden, and the visual level format string is used.
Element. You can set a format string for data labels and for specific elements of the new card and the new slicer visuals. This level will be expanded to include much more in the future. Any format string you set here will override the format string set on the visual and model level.
These levels are hierarchical, with the model level being the lowest level and the element level the highest. A format string defined on a column, measure or visual calculation on a higher-level override what was defined on a lower level.
Since visual calculations are not in the model, they cannot have a format string set on the model level but can on the visual or element level. Measures and columns can have format strings on all three levels:
Level
Impacts
Available for
ELEMENT
Selected element of the selected visual
X
X
Visual
Selected visual
X
X
Model
All visuals, all pages, all reports on the same model
X
The image below summarizes this and shows that higher level format strings override lower-level format strings:
Let’s look at an example using a measure.
I have a Profit measure in my model, which is set to a decimal number format. To do this, you might have set the formatting for this measure using the ribbon:
Alternatively, you could have made the same selections in the properties pane for the measure in the model view or entered the following custom formatting code:
If you put this measure on a visual it now returns a decimal number, as expected:
However, on a particular visual you want that measure to be formatted as a whole number. You can now do that by setting the format code on the visual level by opening the format pane for that visual and the Data format options found there under General:
Now that same measure shows as a whole number, but just on that visual:
On top of that, you might want to use a scientific notation for that measure but only in the data label on a particular visual. No problem, you set the format code on the data label for that measure:
So now the total shows in scientific notation, but only in the data label and not in other places (such as the tooltip as shown below). Notice how the element level format is used in the data label but the visual or model level format string is still used for the other elements in the same visual.
For visual calculations the same principle applies but of course without the model level. For example, if you have a visual calculation that returns a percentage, you can now format it as such using the Data Format options in the General on the visual in the format pane:
The ability to set visual level format strings makes it much easier to get the exact formatting you need for your visualizations. However, this is only the first iteration of the visual level format strings. We are planning to add the settings you’re used to for the model level format strings to the visual level soon.
Since visual level format strings are introduced as part of the visual calculations preview, you will need to turn on the visual calculations preview to use them. To do that, go to Options and Settings > Options > Preview features . Select Visual calculations and select OK . Visual calculations and visual level format strings are enabled after Power BI Desktop is restarted.
Please refer to our docs to read more about format strings or visual calculations .
Dynamic per recipient subscriptions (Generally Available)
We are excited to announce the general availability of Dynamic per recipient subscriptions for Power BI and paginated reports. Dynamic per recipient subscriptions is designed to simplify distributing a personalized copy of a report to each recipient of an email subscription. You define which view of the report an individual receives by specifying which filters are applied to their version of the report. The feature is now available in Sov. Clouds as well.
Connect to data that has recipient email, names or report parameters.
Then, select and filter data that you want in your subscription. You probably only want to send emails conditionally. To do that, you can filter the data in the “Filter” pane.
You can select the recipient email addresses and the email subject from the dataset that you connected to by selecting “Get Data”.
You can then map your data to the subscription.
Then schedule the subscription and save it.
The subscriptions will be triggered based on the schedule that you have set up. Personalized reports can be sent to up to a thousand recipients! Learn more about Dynamic per recipient subscriptions for Power BI reports, and paginated reports .
Do you have reports that are too large to be delivered by email? Do you have reports that are eating into your email in just a few weeks, or do you need you to move it to a different location? You can now deliver Power BI and paginated report subscriptions to OneDrive or SharePoint. With this capability, you can schedule and send full report attachments to a OneDrive or SharePoint location. Learn more about how to deliver report subscriptions to OneDrive or SharePoint .
Updated Save and Upload to OneDrive Flow in Power BI
Beginning the first week of August, desktop users should see a preview switch starting in SU8 to turn on the updated Save and Upload to OneDrive experience in Power BI. To enable this, navigate to the Preview features section of Options in Power BI. Users will then need to select “Saving to OneDrive and SharePoint uploads the file in the background”.
With these updates, we’ve improved the experience of uploading new Power BI files to OneDrive, and easily upload new changes in the background.
For uploading new files, after navigating to the correct location in the OneDrive file picker and saving, a dialog box appears while the file is being uploaded. The option to cancel the upload is there if needed. This dialog will only show up the first time a new file is uploaded to OneDrive.
Dialog for saving a new file to OneDrive.
When new changes are saved to a file uploaded to OneDrive, the top of the toolbar indicates that the new changes are also being uploaded to OneDrive.
Additional changes being uploaded in the background to the existing file.
If you click on the title bar flyout in the toolbar, you can also now access more information about the file. Clicking “View your file in OneDrive” will provide a direct link to where the file is stored in OneDrive.
Drop down including the link to the file in OneDrive.
We are introducing the data limit capability to help you manage performance issues. This feature allows you to set the maximum data load for a single session per visual displaying only the rows of data in an ascending order by default.
To use this feature:
Go to the ‘Filters on this visual’ menu in the filter pane.
Set your desired data limit value.
The filter card features include:
Removing, locking, or clearing filters.
Hiding or showing filters.
Expanding or collapsing filter cards.
Applying filters.
Renaming and reordering filters.
Report consumers can see any data limits applied to a visual in the filter visual header, even if the filter pane is hidden.
Visuals, shapes and line enhancements
Over the past few months, we have been fine-tuning the visual elements of your reports, including columns, bars, ribbons, and lines. We have given you the ability to craft these Cartesians with precision. However, we noticed that the legends and tooltips were not quite accurate .
With the latest update, the legend and tooltip icons will now automatically and accurately reflect per-series formatting settings, such as border colors, shapes, and line styles. This makes it easier to match series to their visual representations. Additionally, we have added consistency to how per-series formatting is applied to line charts, column/bar charts, scatter charts, and other Cartesian formatting options for common items like error bars and anomalies.
Check out the Reporting demos here:
DAX query view in the web
Write DAX queries on your published semantic models with DAX query view in the web. DAX query view, already available in Power BI Desktop, is now also available when you are in the workspace.
Look for Write DAX queries on your published semantic model.
Right-click on the semantic model and choose Write DAX queries .
Click on the semantic model to open the details page, then click Write DAX queries at the top of the page.
This will launch DAX query view in the web, where you can write DAX queries, use quick queries to have DAX queries written for you on tables, columns, or measures, or use Fabric Copilot to not only write DAX queries but explain DAX queries, functions, or topics. DAX queries work on semantic models in import, DirectQuery, and Direct Lake storage mode.
Write permission, that is permission to make changes to the semantic model, is currently needed to write DAX queries in the web. And, the workspace setting, User can edit data models in the Power BI service (preview) , needs to be enabled.
DAX query view in the web includes DAX query view’s way to author measures. Define measures with references, edit any of them, and try out changes across multiple measures by running the DAX query, then update the model with all the changes in a single click of a button. DAX query view in web brings this functionality for the first time to semantic models in Direct Lake mode!
If you do not have write permission, you can still live connect to the semantic model in Power BI Desktop and run DAX queries there.
Try out DAX query view in web today and learn more about how DAX queries can help you in Power BI and Fabric.
Deep dive into DAX query view in web
DAX queries
Work with DAX query view
Deep dive into DAX query view and writing DAX queries
Write DAX queries with Copilot
Deep dive into DAX query view with Copilot
Overview of Copilot for Power BI
Direct Lake
Check out a Modeling demo here:
Embedded Analytics
Narrative visual with copilot available in saas embed.
We are excited to announce that the Narrative visual with Copilot is available for user owns data scenarios (SaaS) and secure embed. This means when a user embeds a report containing the narrative visual in a solution where users must sign in – they will now be able to the visual refresh with their data. The first step on our Copilot embed journey!
When you embed a Power BI report in an application in the “embed for your organization” scenario, it allows organizations to integrate rich, interactive data visualizations seamlessly into their internal tools and workflows. Now this solution supports the Copilot visual. A sales team might want to embed a Power BI report in their internal CRM application to streamline their workflow. By integrating sales performance dashboards directly into the CRM, team members can easily monitor key metrics like monthly sales targets, pipeline status, and individual performance, without switching between different tools. This integration enables quicker access to actionable insights, helping the team make informed decisions, identify trends, and react swiftly to market changes, all within the secure environment of their organization’s data infrastructure.
Supported Scenarios:
Embed a report in a secure portal or website Power BI.
User owns data : A user embeds a report containing the narrative visual in a solution where users must sign in. They need a license to do so. This action is also known as embed for your organization . It includes when users want to embed visuals in solutions like PowerPoint as well.
Unsupported Scenario:
App owns data: A customer embeds a narrative visual on a website where users visit, and don’t need to sign in. Also known as embed for your customer’s application .
To get this set up, there are a few steps to follow – so make sure to check out the documentation . Embed a Power BI report with a Copilot narrative visual – Power BI | Microsoft Learn
You will need to Edit your Microsoft Entra app permissions to enable the embedded scenario to work.
From here you’ll need to add the MLModel.Execute.All permission.
Check out the documentation for additional details.
Check out an Embedded Analytics demo here:
Visualizations
Icon Map Pro hi-chart Reporting Studio Water Cup Performance Flow – xViz Sunburst by Powerviz Zebra BI Tables 7.0 Enlighten Storyteller Inforiver Writeback Matrix Drill Down Pie PRO (Filter) by ZoomCharts (microsoft.com) Spiral Plot By Office Solution Polar Scatter Plot By Office Solution Hanging Rootogram Chart for Power BI Bar Chart Run Time Convertible Scatter Plot Circular Dendrogram Chart for Power BI Barley Trellis Plot By Office Solution Connected Scatter Plot Chart For Power BI Dot Plot Chart by Office Solution Voronoi Diagram By Office Solution Fish Bone Chart for Power BI Icon Array Chart for Power BI
Powerviz Filter is an advanced Power BI slicer (Free Visual) that applies a page-level filter to the data. It stands out for its user-friendly design and customization flexibility, with developer-friendly wizard.
Key Features:
Hierarchy Control : Support multiple hierarchies with expand/collapse and by-level formatting
Ragged Hierarchy Support: Hide BLANK category/values, or both, and display child as parent.
Keep selected items at Top : enable this to show your selected items at top.
Display Mode : Seamlessly switch between pop-up/canvas modes.
Default Selection: Select default categories/values that automatically get filtered on refresh.
Selection Mode: Single-select, multiple-select, or select-all with only single-selection.
Image: Add images alongside the filter. HTML Links/Base-64 URLs Support.
Title-Bar Options: Search Bar, Clear Icon, Ranking, Filter, Sorting, Expand/Collapse.
Conditional Formatting: Highlight font and row background color based on specific rules.
Template: Choose from professionally created light/dark templates, and easily customize them using the Global styling option.
Other features included are Import/Export Themes, Interactivity, Filter Style, and more.
Slice to Spice: Transform your Pie Chart by Clicking! Dive deeper with a click, creating a new pie!
Pie of Pie by JTA – a Data Scientist’s Visualization Tool
Slice, Click, Reveal: Explore Deeper Insights with Our Interactive Pie Chart Visual for Power BI!
A Power BI custom visual that enables the creation of a hierarchical representation within a Pie Chart. With a simple click, you can effortlessly delve into detailed categories, offering a seamless and visually intuitive way to unveil multi-level insights in a single view.
Experience the convenience of interactive data analysis, where each slice of the initial pie chart acts as a gateway to deeper layers of information. Whether you’re dissecting population demographics, dissecting sales performance, or analysing product distribution, Pie of Pie offers a seamless and visually intuitive solution.
Interactive hierarchical representation within a Pie Chart: Dive into detailed categories with ease, exploring multi-level insights seamlessly.
Effortlessly explore multi-level insights with a single click: Click on a slice to reveal deeper layers of information, enhancing your data analysis experience.
Customizable colours, labels, and legend: Tailor the visual to match your branding or personal preferences, ensuring clarity and consistency in your reports.
Choose where to display always both pies and just show the second upon click: Optimize your visual presentation by selecting the most suitable display mode for your data storytelling needs.
Animate the visual: Bring your data to life with smooth animations, captivating your audience and enhancing engagement with your insights.
Personalize the spacing: Fine-tune the spacing between elements to achieve the perfect balance of aesthetics and readability in your visualizations.
Download Pie of Pie by JTA for free: AppSource
Try Pie of Pie by JTA: Demo
Youtube video: Youtube
Learn more about us: JTA The Data Scientists
Everyone knows what a pie chart is – for centuries, it has been the most popular way to visualize data. But what makes Drill Down Pie PRO special is the incredible amount of flexibility it offers to creators. Enjoy a wide range of customization features (colors, fonts, legends, labels, and more), create up to nine levels of drill down hierarchy, and declutter the chart with an interactive ‘Others’ slice that users can expand with just a click.
What’s more, this visual can be more than just a pie chart – it can be an interactive navigation tool for the entire report. When the user selects a slice or drills down, it will cross-filter other visuals on the report, instantly revealing focused insights. Create faster, more intuitive, and more insightful reports with ZoomCharts!
Main Features:
On-chart drill down
Cross-chart filtering
Up to 9 levels of hierarchy
Adjustable ‘Others’ slice
Color, label, and legend customization
Custom tooltip fields
Touch support
🌐 Get Drill Down Pie PRO on AppSource
Product Page | Documentation | Follow ZoomCharts on LinkedIn
Hierarchical bar chart displays hierarchical data (different fields having parent/child relationship) in the form a bar/column chart with +/- signs to view/hide details or child elements.
A new feature was added to the visual in Jun 24 whereby the users can display CAGR between the 2 values by clicking the bars one after another (after turning on “CAGR” from format pane).
This visual has the following key features.
1) Expand/ Collapse bars using (+/-) buttons
2) Show variance between bars
3) Show CAGR between bars
4) Drag the bars for custom sorting
5) Click on legends to drill down/up to any level
6) Show targets
Watch a demo of these features in short video below
https://www.youtube.com/watch?v=kOcs5RNY-Zs
Download this visual from APPSOURCE
Download demo file from APPSOURCE
For more information visit https://www.excelnaccess.com/hierarchical-barchart/
Deneb is a free and open-source certified custom visual that allows developers to create their own highly bespoke data visualizations directly inside Power BI using the declarative JSON syntax of the Vega or Vega-Lite languages.
This is like the approaches used for creating R and Python visuals in Power BI, with the following additional benefits:
Everything in-visual —no additional dependencies on local libraries or gateways for your end-users when publishing reports.
Microsoft certified runtime —any visual you create receives the same benefits of a certified custom visual, meaning your design will work anywhere Power BI works, including Publish to Web, mobile, PowerPoint, and PDF exports.
Performance —your designs are rendered directly inside Power BI rather than being delegated to another location, keeping data inside your workbook and typically resulting in faster render times for end-users.
Interactivity —You can integrate Power BI’s interactivity features (tooltips, Drillthrough, cross-filtering, and cross-highlighting with some additional setup.
📢Our latest version brings many of our top requested new features to the development experience, including:
Dark mode —toggle between the traditional light theme and dark theme to reduce eye strain.
Commenting —you can now add comments to your JSON for documentation and debugging purposes.
Auto-completion improvements —suggestions will now be recommended based on the details in the Vega and Vega-Lite schemas.
Inline language documentation (for Vega-Lite)—the documentation the Vega team makes available for Vega-Lite in its language schema is now available when you hover your mouse over an appropriate location in your JSON. This will help you discover more language features within Deneb itself, and any hyperlinks will navigate you to the correct location on the Vega-Lite documentation site for further reading.
Auto unit formatting —a new format type that applies the same logic as Power BI format numbers in K, M, Bn, etc., with less effort than the existing Power BI value formatter.
Advanced cross-filtering (for Vega)—new expression functions to help generate cross-filtering of report items based on a filter against the original dataset sent to Deneb before any transformations may have been applied.
We have many other enhancements in this release, and you can find out more about how these can help you and your readers by:
Visting the Change Log on Deneb’s website
Checking out our YouTube spotlight videos on key new features
Downloading Deneb from AppSource
Getting inspired by examples from our community or the sample workbook
Following Deneb
Paginated Reports: Sharing of reports connecting to Get Data data sources made easy
We announced the ability to create paginated reports from Power BI Report Builder by connecting to over 100 data sources with the Get Data experience. You can learn more about Connect paginated reports to data sources using Power Query (Preview) – Power BI | Microsoft Learn. You no longer need to share the shareable cloud connection. You only need to share the report and ensure that those consuming the report have access to view the report. This update will be rolling out in the coming weeks.
That is all for this month!
We hope that you enjoy the update! If you installed Power BI Desktop from the Microsoft Store, please leave us a review .
As always, keep voting on Ideas to help us determine what to build next. We are looking forward to hearing from you!
embedded analytics
Microsoft Fabric
paginated reports
semantic model
Preferences
Web 2.0 - PowerPoint PPT Presentation
Universities: Splendid dinosaurs in the coming age of clever little techno-mammals. ... Web 2.0 is creating a new commons. New technology challenges old assumptions ... – PowerPoint PPT presentation
The Twentieth Century is now a museum.Get over it.
Universities Splendid dinosaurs in the coming age of clever little techno-mammals.
Social media Intentional community or granfalloon?
The digital revolution is not over.
Printing press is 208,000 days old.
America is 85,000 days old.
I am 22,000 days old.
The Web is 7000 days old.
Amazon is 5000 days old.
Google is 4000 days old.
Wikipedia is 3000 days old.
Youtube is 1500 days old.
Facebook and Twitter are 1000 days old.
communication
collaboration
cloud computing
All leading to the development and evolution of web-based communities and hosted services, such as social-networking sites, wikis, blogs, and folksonomies.
Web 2.0 is creating a new commons
New technology challenges old assumptions
Social Learning in Media Bloghttp//janeknight.ty pepad.com/socialmedia/
Mashable The social media guidehttp//mashable. com/
Janes eLearning pick of the dayhttp//janeknight .typepad.com/pick/
ePortfolios for Learninghttp//electronicportfoli os.org/blog/
Here Comes Everybody by Clay ShirkyAmazon
Everything Is Miscellaneous by David WeinbergerAmazon
Facebook and privacy--a video with Kris Krughttp//www.youtube.com/watch?vB677hoo7uXAfe aturerelated
PowerShow.com is a leading presentation sharing website. It has millions of presentations already uploaded and available with 1,000s more being uploaded by its users every day. Whatever your area of interest, here you’ll be able to find and view presentations you’ll love and possibly download. And, best of all, it is completely free and easy to use.
You might even have a presentation you’d like to share with others. If so, just upload it to PowerShow.com. We’ll convert it to an HTML5 slideshow that includes all the media types you’ve already added: audio, video, music, pictures, animations and transition effects. Then you can share it with your target audience as well as PowerShow.com’s millions of monthly visitors. And, again, it’s all free.
About the Developers
PowerShow.com is brought to you by CrystalGraphics , the award-winning developer and market-leading publisher of rich-media enhancement products for presentations. Our product offerings include millions of PowerPoint templates, diagrams, animated 3D characters and more.
PowerPoint Slide or Lecture Note References
This page contains reference examples for PowerPoint slides or lecture notes, including the following:
PowerPoint slides available online
PowerPoint slides from a classroom website
Use these formats to cite information obtained directly from slides.
If the slides contain citations to information published elsewhere, and you want to cite that information as well, then it is best to find, read, and cite the original source yourself rather than citing the slides as a secondary source.
Writers creating PowerPoint presentations in APA Style should present information clearly and concisely. Many APA Style guidelines can be applied to presentations (e.g., the guidance for crediting sources, using bias-free language, and writing clearly and concisely).
However, decisions about font size, amount of text on a slide, color scheme, use of animations, and so on are up to writers; these details are not specified as part of APA Style.
1. PowerPoint slides available online
Jones, J. (2016, March 23). Guided reading: Making the most of it [PowerPoint slides]. SlideShare. https://www.slideshare.net/hellojenjones/guided-reading-making-the-most-of-it
Parenthetical citation : (Jones, 2016)
Narrative citation : Jones (2016)
When the slides are available online to anyone, provide the site name on which they are hosted in the source element of the reference, followed by the URL of the slides.
2. PowerPoint slides from a classroom website
Mack, R., & Spake, G. (2018). Citing open source images and formatting references for presentations [PowerPoint slides]. Canvas@FNU. https://fnu.onelogin.com/login
Parenthetical citation : (Mack & Spake, 2018)
Narrative citation : Mack and Spake (2018)
If the slides come from a classroom website, learning management system (e.g., Canvas, Blackboard, Moodle, Sakai), or company intranet and you are writing for an audience with access to that resource, provide the name of the site and its URL (use the login page URL for sites requiring login).
If the audience for which are you writing does not have access to the slides, cite them as a personal communication .
PowerPoint slide references are covered in the seventh edition APA Style manuals in the Publication Manual Section 10.14 and the Concise Guide Section 10.12
50,000+ PowerPoint Templates
Download ready-made powerpoint slides & 100% editable templates for your presentations. finish your work in less time., featured slide templates.
Mission and Vision PowerPoint Template
Modern Flat Gears PowerPoint Template
Spherical 4 Stages PowerPoint Diagram
Go-To-Market PowerPoint Template
Professional Report Infographics PowerPoint Template
Creative 3D Box Diagram Template for PowerPoint
Professional Company Profile PowerPoint Template
4 Options Diagram Template for PowerPoint with 3D Boxes
Customer Life Journey PowerPoint Diagram
Professional Business Presentation Template
US Map Template for PowerPoint with Editable States
Global Company Profile PowerPoint Template
New slide templates.
Industry Analysis PowerPoint Template
Multi-Step Ribbon Diagram Template for PowerPoint
6 Pieces 3D Tetris Cube PowerPoint Diagram
Project Management Dashboard PowerPoint Template
Simple and easy to use professional presentation templates.
Save hundreds of hours of manual work, be more productive and impress your audience with visually appealing PPT slides templates that are 100% editable.
Fully 100% Editable Templates
To make your editing process faster and easier, we made sure that all our templates and slide objects are fully editable in Microsoft PowerPoint, Google Slides, Keynote and OpenOffice. Both in size and color, even for advanced editing objects (points and curves).
Impress your audience
Make the right move and engage your employees, clients, investors and stakeholders with awesome slide designs for PowerPoint presentations and Google Slides templates that are less boring than the default templates. Make your boss say "Yes!" by presenting awesome presentation reports with stunning graphics.
Trusted by over 15,000 businesses and 350,000 users
Fantastic range of slide templates and in different aspects. Fascinating to work through what is available. I am delighted with my subscription which offers excellent value.
I am a customer and have used the PowerPoint templates to support several business and training sessions. I contacted SlideModel about modifying some of the people images to reflect more diversity. The images were modified and sent to me in less than an hour. I was impressed and amazed. This allowed me to continue to be productive, meet my deadline, and create an awesome slide presentation.
I found the slide I needed within the first 10 minutes and was able to edit and move forward with my project immediately.
100% Risk Free - Money Back Guarantee or try our Free PowerPoint Templates
Your Personal Concierge
Save more time. We can help you to pick the right slide template.
Get help to decide what is the best plan for you.
We can provide assistance in case you have questions.
We can help you to choose a different color palette.
Weekly Presentation Slides
24/7 support, easy to customize, 50,000+ templates.
How To Present A Webinar Without PowerPoint Slides
Interoffice Communication Over Your Existing Computer Network
Add TEXTS like a PRO in PowerPoint (3 CREATIVE WAYS) ⚡
🔥 Презентация для продающего вебинара в PowerPoint
Create Beautiful Photo Frame in 58 seconds #powerpoint #ramgopalppt
PowerPoint Tutorial For Beginners!✨
COMMENTS
PPT PowerPoint Presentation
PowerPoint Presentation - Web 2.0. Web 2.0. The Read/Write Web. History Tim Berners-Lee: World Wide Web 1989 Dream of sharing information back and forth Mosaic Web browser in 1993 Writing to the web required knowledge of HTML codes and more. The New World Wide Web New way software developers and users utilize the web.
Web 2.0 Digital Tools Selection: Online Presentation Tools
In Part 1 of this series, Web 2.0 Digital Tools Selection Criteria, I shared a method for evaluating digital learning tools that may find their way into our online courses. In this continuation entry, I will demonstrate the method in action by discussing tools which I evaluated as part of my course work for Introduction to Online Presentation Tools. If you missed the last entry and want a ...
Get started with PowerPoint for the web
Here's how to get started: Go to Office.com. Click PowerPoint. Create a new, blank presentation, start with a template, or open an existing file. When you start with a new, blank presentation, PowerPoint automatically saves it to OneDrive with a default name, such as Presentation 1. To rename your presentation, do the following:
Create a presentation in PowerPoint for the web
Notes: If you're using the desktop version of PowerPoint on a Windows PC, see the PowerPoint Quick Start.. If you're using the desktop version of PowerPoint on a Mac, see Office for Mac Quick Start Guides and PowerPoint for Mac Help.
Free Online Slide Presentation: PowerPoint
Share and collaborate. Start with Microsoft Copilot. Generate a presentation outline instantly with Microsoft Copilot for Microsoft 365. Expand your ideas. Ask for more information or a new slide on your topic directly through Copilot in PowerPoint. Use a free template. Choose from thousands of customizable templates to kickstart your slideshow.
Create and open a presentation in PowerPoint for the web
And when you need more functionality, you can work on the presentation together in the PowerPoint desktop app and all of your changes will be saved online. To convert your Google Slides to PowerPoint, go to File > Download > Microsoft PowerPoint (.pptx). Then open the file in PowerPoint. See more at Get started with Sheets.
PowerPoint Tips: Web 2.0 reflections in PowerPoint
Maybe Web 2.0 is already an old look, but you still see a lot of it. Of course, Web 2.0 really refers to how a website functions-especially interactivity and sharing. ... Step by step instruction on how to apply a slide master to an existing PowerPoint presentation. Read More September 10, 2014 Create Torn Edge Effect in PowerPoint Learn how ...
PPT
Presentation Transcript. Background • Web 2.0, a phrase coined by O'Reilly Media in 2004, [1] refers to a perceived second-generation of Web-based services—such as social networking sites, wikis, communication tools, and folksonomies—that emphasize online collaboration and sharing among users. • O'Reilly Media, in collaboration with ...
Features of Web 2.0
Features of Web 2.0 - Free download as Powerpoint Presentation (.ppt / .pptx), PDF File (.pdf), Text File (.txt) or view presentation slides online. The key features of Web 2.0 include allowing users to freely tag and categorize information (folksonomy), providing dynamic content that responds to user input for a rich experience, and enabling users to generate content, not just website owners.
Teaching and Learning Resources / Web 2_0 Tools
Web 2.0 describes the changing trends in the use of World Wide Web technology and web design that aim to enhance creativity, ... This PowerPoint presentation contains hyperlinks and suggested uses. A revised version (2009) of this PowerPoint includes Google videos and more of an overview format--Imagine.Overview.
Login
Collaborate for free with online versions of Microsoft Word, PowerPoint, Excel, and OneNote. Save documents, workbooks, and presentations online, in OneDrive. Share them with others and work together at the same time.
Web 2.0
3. Web 2.0 Evolution Towards a Read/Write Platform. Web 1.0 (1993-2003) Pretty much HTML pages viewed through a browser Web 2.0 (2003- beyond)Web pages, plus a lot of other content shared over the web, with more interactivity more like an application than a page. Read Mode Write Contribute. Page Primary Unit of content Post / record.
PPT
Web 2.0 & Pedagogy. The Digital Native " Those who grow up immersed in digital technologies, for whom a life fully integrated with digital devices is the norm." ... Chapter 2 : PowerPoint Presentation GO! with Microsoft Excel ® 2007 Comprehensive 1e - Original Chapter 2 Chapter 2 Using Multiple-Sheet Workbooks. Objectives. Work with a ...
PPT
The Internet and Web 2.0 challenge our concepts of how students learn and how we should teach .Web 2.0 technologies are changing media and challenging schools. Web 2.0 refers to a supposed second generation of Internet based services that emphasize online collaboration and sharing among users.Wisdom of Crowds--what are the most valuable resources.
Explore 10+ Free PowerPoint Templates and Presentation Sites
2. Neat Appearance: Uniformity and Professionalism. The art of selecting free PPT templates is to make the content appealing and professional in structure. The tricky part of this leads many to delegate PowerPoint presentation design in order to be able to provide their target audience with content in a format that suits their needs and taste. 3.
(PDF) Selecting a Web 2.0 Presentation Tool
Download Free PDF. View PDF. By Charles B. Hodges and Kenneth Clark SELECTING A WEB 2.0 PRESENTATION TOOL TABLE 1: POPULAR ONLINE PRESENTATION TOOLS PRESENTATIONS IN THE CLOUD Online presentation tools, an emerging type of Web 2.0 tool, can be used in many different ways in education.
Give a presentation in PowerPoint for the web
Start a presentation. On the View tab select Play from Beginning. To move to the previous or next slide, select Previous or Next . To view all the slides in your presentation, select See all slides. Subtitles. You can choose which language the caption/subtitle text should be shown to your audience. This feature is compatible with the following ...
Web 2'0 Overview
World's Best PowerPoint Templates - CrystalGraphics offers more PowerPoint templates than anyone else in the world, with over 4 million to choose from. Winner of the Standing Ovation Award for "Best PowerPoint Templates" from Presentations Magazine. They'll give your presentations a professional, memorable appearance - the kind of sophisticated look that today's audiences expect.
SlideAware makes PowerPoint a Web 2.0 app
SlideAware works with PowerPoint to put your presentations on the Web. We're big fans of Web-based productivity apps here at Webware, but we also like tools that bring Web 2.0 features, such as ...
Web 2.0
World's Best PowerPoint Templates - CrystalGraphics offers more PowerPoint templates than anyone else in the world, with over 4 million to choose from. Winner of the Standing Ovation Award for "Best PowerPoint Templates" from Presentations Magazine. They'll give your presentations a professional, memorable appearance - the kind of sophisticated look that today's audiences expect.
How to take advantage of Copilot for SharePoint
2. Interact with data stored in SharePoint. Employees can also use Copilot to locate content easily. With Microsoft Copilot Studio -- which lets users create automations and bots -- or standard Copilot, users can ask the tool for any information accessible to them and stored in SharePoint without having to search for or locate it themselves.
Fine-tuning now available for GPT-4o
GPT-4o fine-tuning is available today to all developers on all paid usage tiers (opens in a new window).. To get started, visit the fine-tuning dashboard (opens in a new window), click create, and select gpt-4o-2024-08-06 from the base model drop-down. GPT-4o fine-tuning training costs $25 per million tokens, and inference is $3.75 per million input tokens and $15 per million output tokens.
Web 2.0 PowerPoint Template (PowerPoint PPTX)
This product ( Web 2.0 PowerPoint Template) is a 8-slide PPT PowerPoint presentation (PPTX), which you can download immediately upon purchase. The PowerPoint template can be used by any company who needs a ready PowerPoint template with a web 2.0 design. The dummy text and photo holders can be changed depending on your needs.
Power BI August 2024 Feature Summary
If you are accessing Power BI on a web browser version older than Chrome 94, Edge 94, Safari 16.4, Firefox 93, or equivalent, you need upgrade your web browser to a newer version by August 31, 2024. Using an outdated browser version after this date, may prevent you from accessing features in Power BI. Version number: v: 2.132.908.
Web 2.0
Web 2.0 is creating a new commons. New technology challenges old assumptions ... - A free PowerPoint PPT presentation (displayed as an HTML5 slide show) on PowerShow.com - id: b0302-NGUyN ... The PowerPoint PPT presentation: "Web 2.0" is the property of its rightful owner.
PowerPoint slide or lecture note references
Writers creating PowerPoint presentations in APA Style should present information clearly and concisely. Many APA Style guidelines can be applied to presentations (e.g., the guidance for crediting sources, using bias-free language, and writing clearly and concisely). ... 2. PowerPoint slides from a classroom website. Mack, R., & Spake, G. (2018 ...
Professional PowerPoint Templates & Slides
Make the right move and engage your employees, clients, investors and stakeholders with awesome slide designs for PowerPoint presentations and Google Slides templates that are less boring than the default templates. Make your boss say "Yes!" by presenting awesome presentation reports with stunning graphics.
Amazon.com: DINOSTRIKE
DINOSTRIKE 2 in 1 Type C and USB Presentation Clicker for Powerpoint Presentations,RF 2.4GHz Wireless Presenter Remote Slide Advancer with Volume Control for Mac Laptop Computer Office Classroom 4.4 4.4 out of 5 stars 346 4.4 out of 5 stars. 346 customer reviews


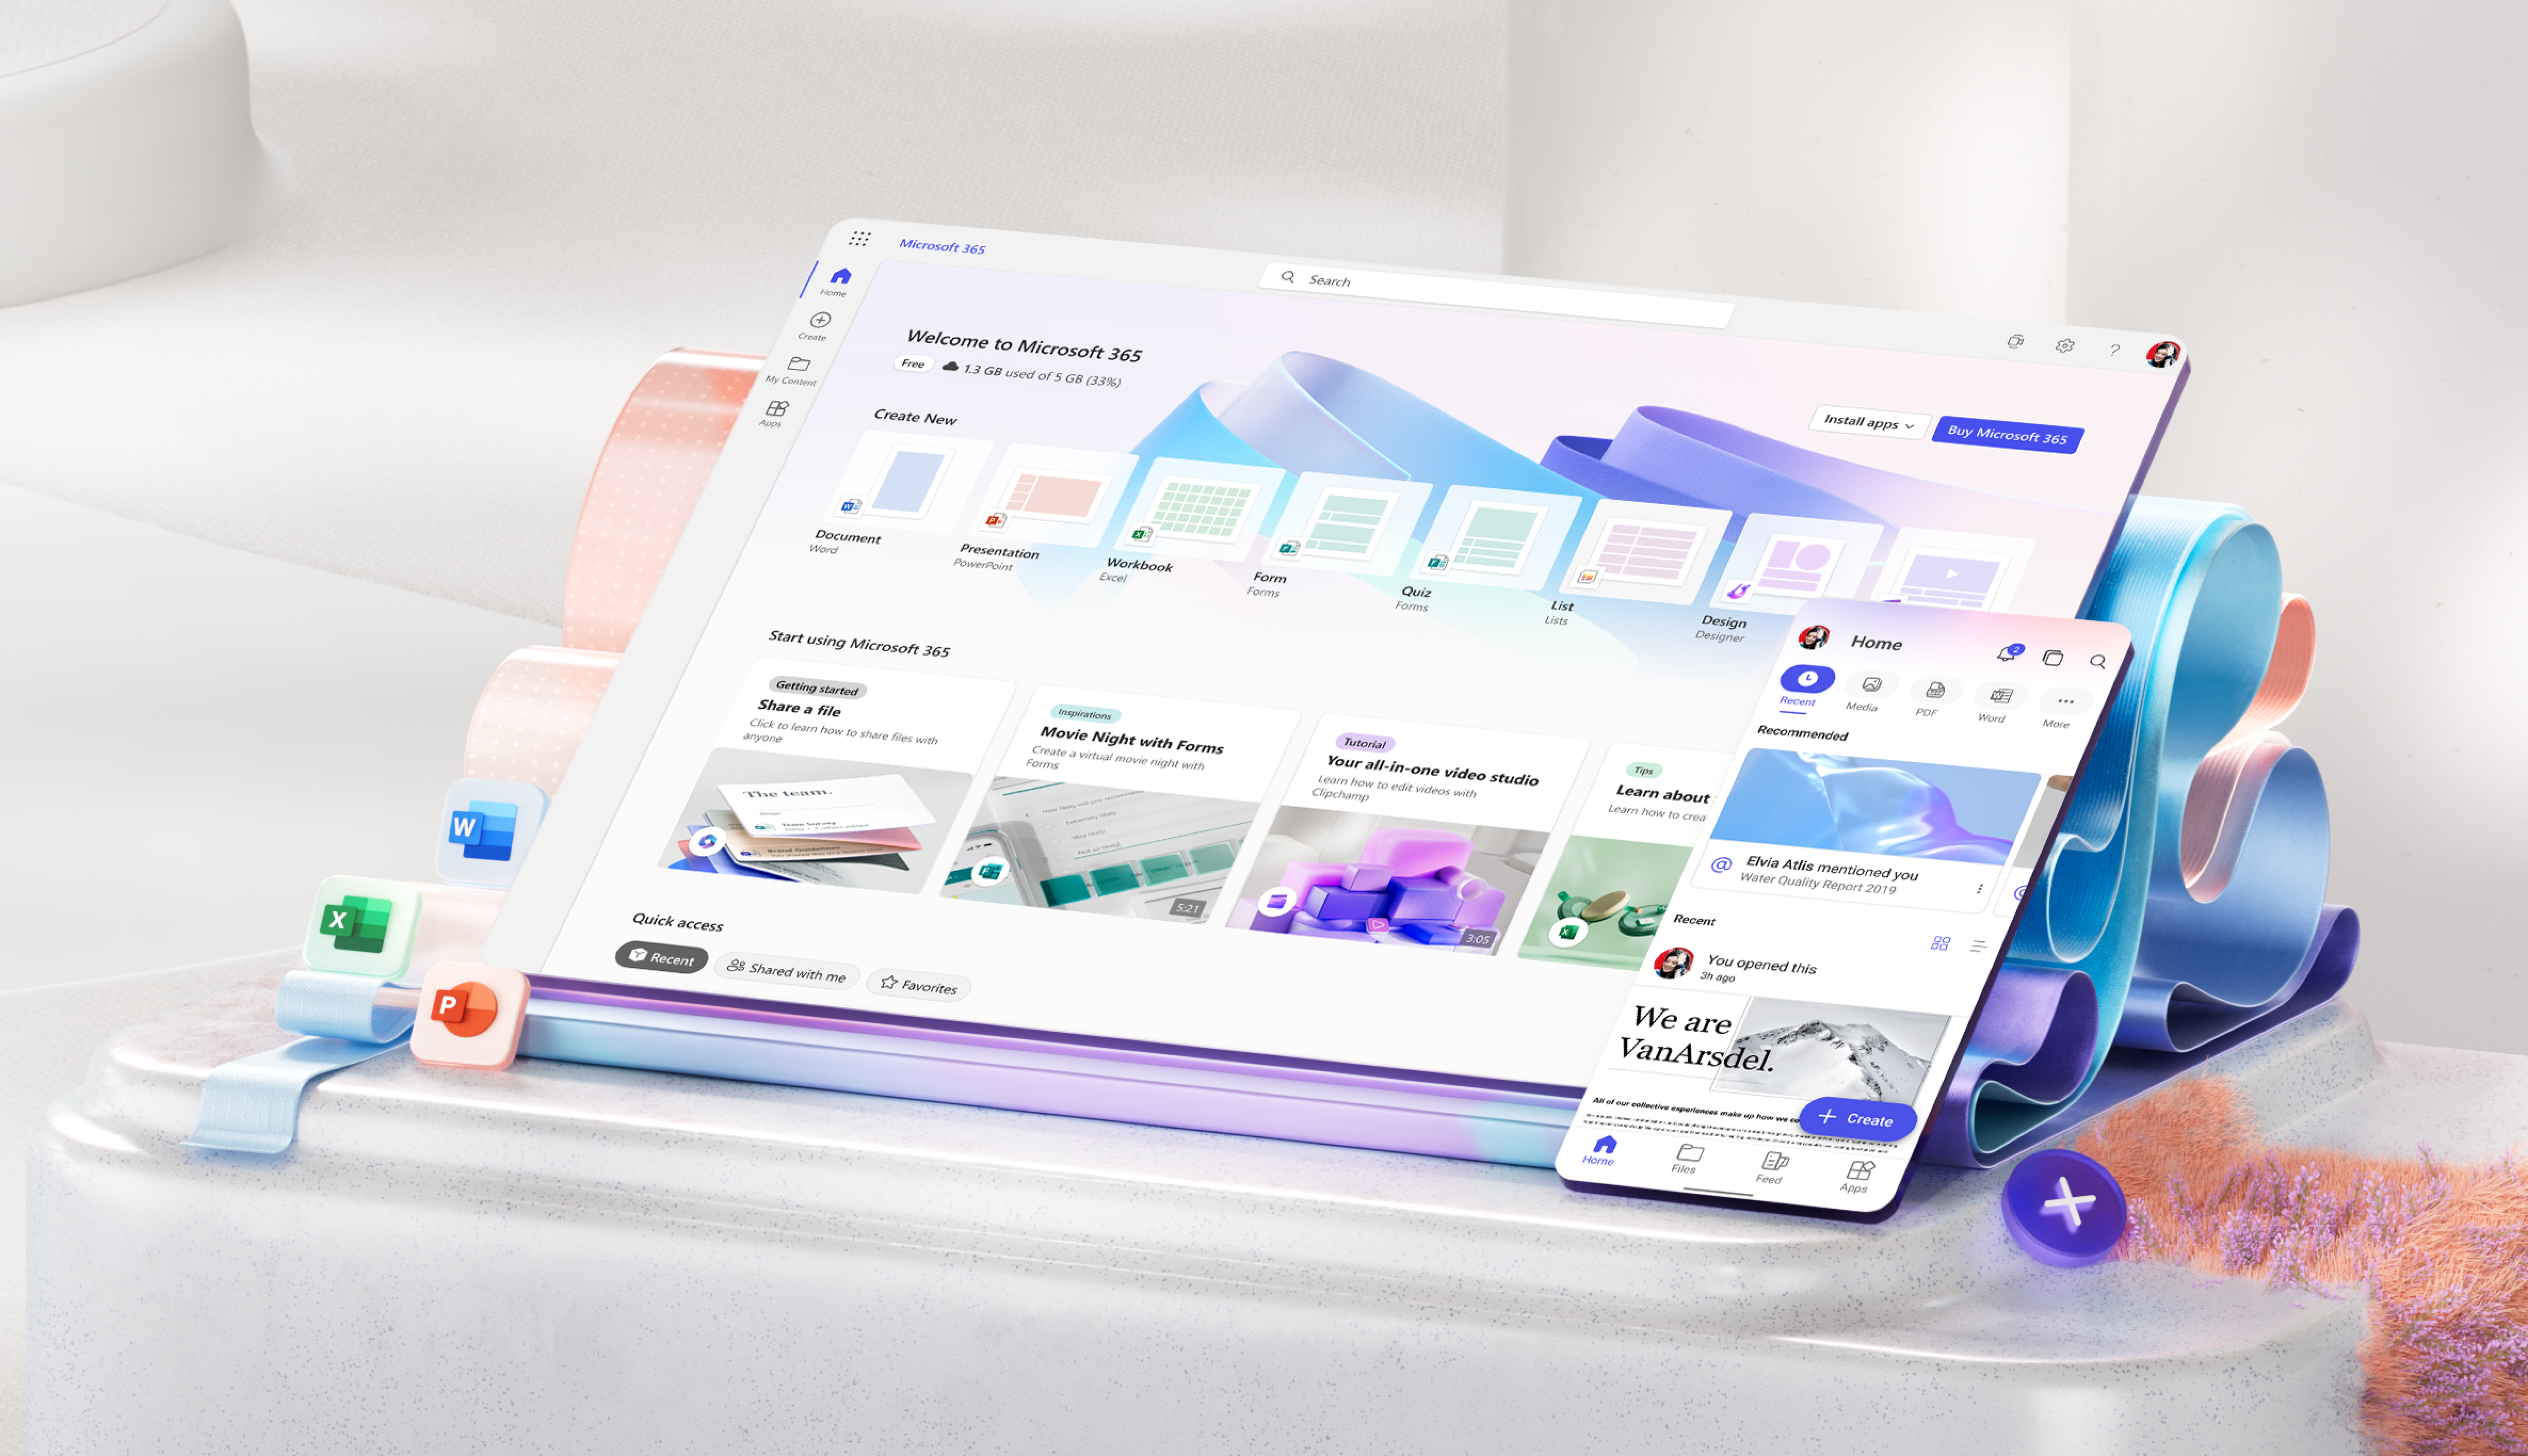


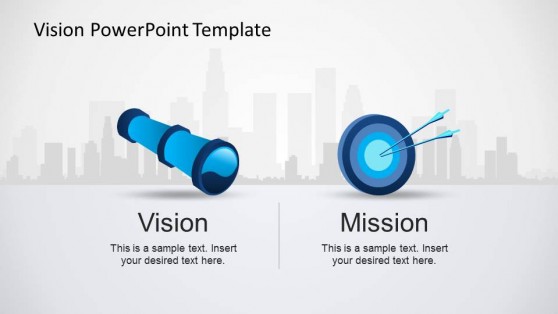


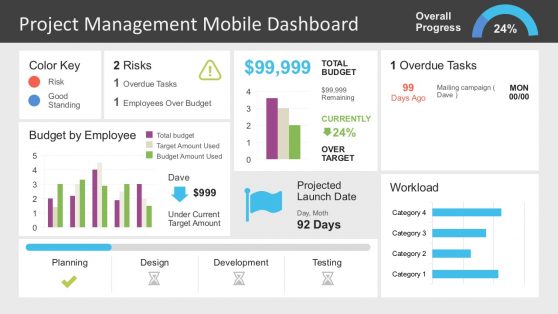


IMAGES
VIDEO
COMMENTS
PowerPoint Presentation - Web 2.0. Web 2.0. The Read/Write Web. History Tim Berners-Lee: World Wide Web 1989 Dream of sharing information back and forth Mosaic Web browser in 1993 Writing to the web required knowledge of HTML codes and more. The New World Wide Web New way software developers and users utilize the web.
In Part 1 of this series, Web 2.0 Digital Tools Selection Criteria, I shared a method for evaluating digital learning tools that may find their way into our online courses. In this continuation entry, I will demonstrate the method in action by discussing tools which I evaluated as part of my course work for Introduction to Online Presentation Tools. If you missed the last entry and want a ...
Here's how to get started: Go to Office.com. Click PowerPoint. Create a new, blank presentation, start with a template, or open an existing file. When you start with a new, blank presentation, PowerPoint automatically saves it to OneDrive with a default name, such as Presentation 1. To rename your presentation, do the following:
Notes: If you're using the desktop version of PowerPoint on a Windows PC, see the PowerPoint Quick Start.. If you're using the desktop version of PowerPoint on a Mac, see Office for Mac Quick Start Guides and PowerPoint for Mac Help.
Share and collaborate. Start with Microsoft Copilot. Generate a presentation outline instantly with Microsoft Copilot for Microsoft 365. Expand your ideas. Ask for more information or a new slide on your topic directly through Copilot in PowerPoint. Use a free template. Choose from thousands of customizable templates to kickstart your slideshow.
And when you need more functionality, you can work on the presentation together in the PowerPoint desktop app and all of your changes will be saved online. To convert your Google Slides to PowerPoint, go to File > Download > Microsoft PowerPoint (.pptx). Then open the file in PowerPoint. See more at Get started with Sheets.
Maybe Web 2.0 is already an old look, but you still see a lot of it. Of course, Web 2.0 really refers to how a website functions-especially interactivity and sharing. ... Step by step instruction on how to apply a slide master to an existing PowerPoint presentation. Read More September 10, 2014 Create Torn Edge Effect in PowerPoint Learn how ...
Presentation Transcript. Background • Web 2.0, a phrase coined by O'Reilly Media in 2004, [1] refers to a perceived second-generation of Web-based services—such as social networking sites, wikis, communication tools, and folksonomies—that emphasize online collaboration and sharing among users. • O'Reilly Media, in collaboration with ...
Features of Web 2.0 - Free download as Powerpoint Presentation (.ppt / .pptx), PDF File (.pdf), Text File (.txt) or view presentation slides online. The key features of Web 2.0 include allowing users to freely tag and categorize information (folksonomy), providing dynamic content that responds to user input for a rich experience, and enabling users to generate content, not just website owners.
Web 2.0 describes the changing trends in the use of World Wide Web technology and web design that aim to enhance creativity, ... This PowerPoint presentation contains hyperlinks and suggested uses. A revised version (2009) of this PowerPoint includes Google videos and more of an overview format--Imagine.Overview.
Collaborate for free with online versions of Microsoft Word, PowerPoint, Excel, and OneNote. Save documents, workbooks, and presentations online, in OneDrive. Share them with others and work together at the same time.
3. Web 2.0 Evolution Towards a Read/Write Platform. Web 1.0 (1993-2003) Pretty much HTML pages viewed through a browser Web 2.0 (2003- beyond)Web pages, plus a lot of other content shared over the web, with more interactivity more like an application than a page. Read Mode Write Contribute. Page Primary Unit of content Post / record.
Web 2.0 & Pedagogy. The Digital Native " Those who grow up immersed in digital technologies, for whom a life fully integrated with digital devices is the norm." ... Chapter 2 : PowerPoint Presentation GO! with Microsoft Excel ® 2007 Comprehensive 1e - Original Chapter 2 Chapter 2 Using Multiple-Sheet Workbooks. Objectives. Work with a ...
The Internet and Web 2.0 challenge our concepts of how students learn and how we should teach .Web 2.0 technologies are changing media and challenging schools. Web 2.0 refers to a supposed second generation of Internet based services that emphasize online collaboration and sharing among users.Wisdom of Crowds--what are the most valuable resources.
2. Neat Appearance: Uniformity and Professionalism. The art of selecting free PPT templates is to make the content appealing and professional in structure. The tricky part of this leads many to delegate PowerPoint presentation design in order to be able to provide their target audience with content in a format that suits their needs and taste. 3.
Download Free PDF. View PDF. By Charles B. Hodges and Kenneth Clark SELECTING A WEB 2.0 PRESENTATION TOOL TABLE 1: POPULAR ONLINE PRESENTATION TOOLS PRESENTATIONS IN THE CLOUD Online presentation tools, an emerging type of Web 2.0 tool, can be used in many different ways in education.
Start a presentation. On the View tab select Play from Beginning. To move to the previous or next slide, select Previous or Next . To view all the slides in your presentation, select See all slides. Subtitles. You can choose which language the caption/subtitle text should be shown to your audience. This feature is compatible with the following ...
World's Best PowerPoint Templates - CrystalGraphics offers more PowerPoint templates than anyone else in the world, with over 4 million to choose from. Winner of the Standing Ovation Award for "Best PowerPoint Templates" from Presentations Magazine. They'll give your presentations a professional, memorable appearance - the kind of sophisticated look that today's audiences expect.
SlideAware works with PowerPoint to put your presentations on the Web. We're big fans of Web-based productivity apps here at Webware, but we also like tools that bring Web 2.0 features, such as ...
World's Best PowerPoint Templates - CrystalGraphics offers more PowerPoint templates than anyone else in the world, with over 4 million to choose from. Winner of the Standing Ovation Award for "Best PowerPoint Templates" from Presentations Magazine. They'll give your presentations a professional, memorable appearance - the kind of sophisticated look that today's audiences expect.
2. Interact with data stored in SharePoint. Employees can also use Copilot to locate content easily. With Microsoft Copilot Studio -- which lets users create automations and bots -- or standard Copilot, users can ask the tool for any information accessible to them and stored in SharePoint without having to search for or locate it themselves.
GPT-4o fine-tuning is available today to all developers on all paid usage tiers (opens in a new window).. To get started, visit the fine-tuning dashboard (opens in a new window), click create, and select gpt-4o-2024-08-06 from the base model drop-down. GPT-4o fine-tuning training costs $25 per million tokens, and inference is $3.75 per million input tokens and $15 per million output tokens.
This product ( Web 2.0 PowerPoint Template) is a 8-slide PPT PowerPoint presentation (PPTX), which you can download immediately upon purchase. The PowerPoint template can be used by any company who needs a ready PowerPoint template with a web 2.0 design. The dummy text and photo holders can be changed depending on your needs.
If you are accessing Power BI on a web browser version older than Chrome 94, Edge 94, Safari 16.4, Firefox 93, or equivalent, you need upgrade your web browser to a newer version by August 31, 2024. Using an outdated browser version after this date, may prevent you from accessing features in Power BI. Version number: v: 2.132.908.
Web 2.0 is creating a new commons. New technology challenges old assumptions ... - A free PowerPoint PPT presentation (displayed as an HTML5 slide show) on PowerShow.com - id: b0302-NGUyN ... The PowerPoint PPT presentation: "Web 2.0" is the property of its rightful owner.
Writers creating PowerPoint presentations in APA Style should present information clearly and concisely. Many APA Style guidelines can be applied to presentations (e.g., the guidance for crediting sources, using bias-free language, and writing clearly and concisely). ... 2. PowerPoint slides from a classroom website. Mack, R., & Spake, G. (2018 ...
Make the right move and engage your employees, clients, investors and stakeholders with awesome slide designs for PowerPoint presentations and Google Slides templates that are less boring than the default templates. Make your boss say "Yes!" by presenting awesome presentation reports with stunning graphics.
DINOSTRIKE 2 in 1 Type C and USB Presentation Clicker for Powerpoint Presentations,RF 2.4GHz Wireless Presenter Remote Slide Advancer with Volume Control for Mac Laptop Computer Office Classroom 4.4 4.4 out of 5 stars 346 4.4 out of 5 stars. 346 customer reviews